In electronic systems, power supply stability is very critical for proper operation and desired performance. A stable power supply is one that provides a constant output voltage regardless of changes in load current or input voltage. The Bode plot is a graphical representation of a system’s frequency response, which can be used to analyze the stability and performance of power supply systems.
In this article, we will explore the Bode plot and its applications in power supply stability analysis from a design perspective.
Page Contents
What is a Bode Plot?
A Bode plot is a graph of the magnitude and phase of a system’s transfer function as a function of frequency. It is a commonly used graphical representation of a system’s frequency response. The magnitude is plotted in decibels (dB) and the phase in degrees. The Bode plot is named after its creator, Hendrik W. Bode, an American engineer and control systems expert.
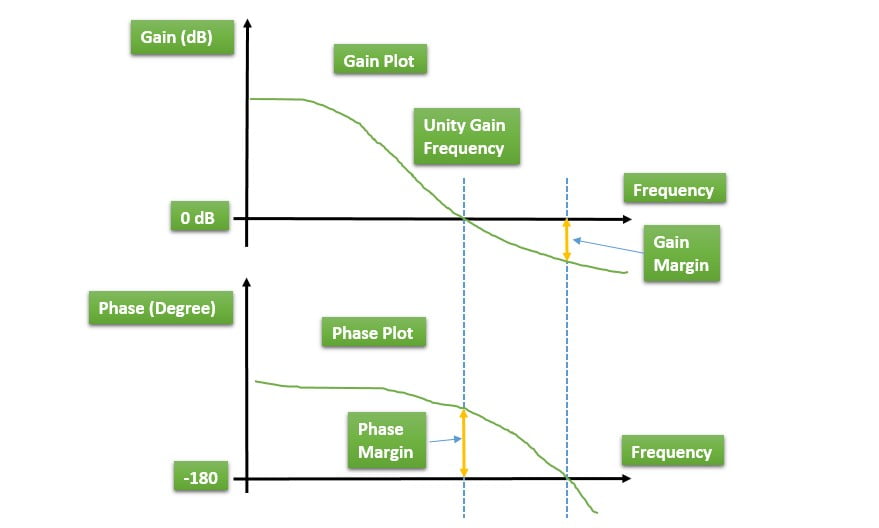
The Bode plot is typically divided into two parts: the magnitude plot and the phase plot. The magnitude plot shows the gain of the system as a function of frequency and the phase plot shows the phase shift of the system as a function of frequency.
Applications of Bode Plot in Power Supply Stability Analysis
A stable power supply is one that provides a constant output voltage regardless of changes in load current or input voltage. Power supply stability can be analyzed using Bode plots.
The Bode plot of a power supply system typically has two regions: a low-frequency region and a high-frequency region. In the low-frequency region, the gain of the system is high and the phase shift is small. In the high-frequency region, the gain of the system is low and the phase shift is large. The frequency at which the gain of the system drops to 0 dB is called the unity gain frequency (fug). The frequency at which the phase shift of the system is 180 degrees is called the phase crossover frequency (fpc).
Power supply systems can become unstable when the phase shift of the system reaches 180 degrees before the gain of the system drops to 0 dB. This is called phase margin, and it is a measure of the stability of the system. A power supply system with a small phase margin is more likely to become unstable than a system with a large phase margin.
Power supply stability can be improved by increasing the phase margin of the system. This can be achieved by adding compensation to the system, such as a phase-lead or phase-lag network. The Bode plot can be used to design and optimize the compensation network to improve the stability of the power supply system.
Design Considerations for Power Supply Stability
Designing a stable power supply system requires careful consideration of various factors, such as the load current, input voltage, output voltage, and system impedance. The following are some design considerations that should be taken into account when designing a stable power supply system:
Critical values for the stability of Switch Mode Power Supplies (SMPS)
There are several critical values that need to be considered to ensure the stability of the power supply system.
One of the critical values is the phase margin, which is the amount of phase shift between the output and input of the power supply system at the frequency where the gain is equal to unity. A phase margin of 45 degrees or higher is considered stable. Another important value is the gain margin, which is the amount of gain reduction needed at the frequency where the phase shift is 180 degrees. A gain margin of 6 dB or higher is considered stable.
The loop gain is also a critical parameter that affects the stability of the power supply system. It should be designed to have a smooth roll-off at high frequencies to avoid oscillations.
Conclusion
Designing a stable SMPS requires careful consideration of critical values such as phase margin, gain margin, loop gain, output impedance, input voltage range, and load current. By taking these values into account and using the Bode plot and compensation network, designers can ensure the stability and performance of their SMPS.


